- | Home |
- Company |
- Contact |
- News |
- S/ware Eng |
- Standards |
- Academic Support |
- Documents |

- | Requirements |
- Compilers |
- Validation |
- RTOS |
- Analysis |
- Hardware |
- Software |
- Resources |
- Products |
FreeRTOS+Trace
FreeRTOS+Trace gives an unprecedented level of insight into the run-time world of embedded software based on FreeRTOS and OpenRTOS. This allows you to solve complex software problems in a fraction of the time otherwise needed, develop more robust designs to prevent future problems and find new ways to improve your software’s performance.
When developing embedded software based on an operating system, a traditional debugger is often insufficient to fully understand the software’s run-time behavior. A debugger shows the current system state and allows you to step through individual functions, but this is a low-level perspective that is not suitable for studying real-time operating system behavior, such as scheduling, blocking and interactions between tasks.
Perhaps your code works fine in isolated tests, but errors occur when running the full integrated system? Your debugger can show you the system state once the problem has been detected, but how did the system reach this state? What tasks have executed, in what order, for how long, and how have they interacted? What input has been received, and when? How much of the CPU time is used by different tasks and interrupt handlers? Generally, what is actually going on in the run-time system?
In collaboration with the FreeRTOS team, Percepio has developed FreeRTOS+Trace, the Tracealyzer for FreeRTOS and OpenRTOS. FreeRTOS+Trace visualizes run-time behavior of your embedded software through more than 20 high-level views that complement the debugger perspective with the “big picture”. You may have used some trace tool before, but this is something extra. The views are interconnected in innovative ways and are very simple and intuitive to use. For a quick preview, watch this VIDEO.
FreeRTOS+Trace provides an unprecedented insight into the run-time world of your system, that gives several high-level benefits in your product development. Solve complex software problems in a fraction of the time otherwise needed, develop more robust designs to prevent future problems and find new ways to improve your software’s performance.
The visualization is based on traces from a lightweight software recorder that hooks into the operating system, so you don’t need any special trace debugger to use FreeRTOS+Trace. This makes FreeRTOS+Trace more than just a lab tool, as the recording can deployed in field use. Some of our customers have the recording active by default in the release build, and thereby get very valuable trace diagnostics on real-world issues, that otherwise would have been hard to analyze.
FreeRTOS+Trace provides a very nice integration with J-Link debug probes, that allows for uploading the trace data directly into FreeRTOS+Trace without using the debugged IDE. FreeRTOS+Trace however works with most debuggers – any debugger capable of storing the RAM contents in .bin, .hex or .mch formats.
Like all Tracealyzer products, FreeRTOS+Trace gives you a 30-day fully functional evaluation period and an included demo trace, allowing for exploring the features of FreeRTOS+Trace without writing a single line of code. There is also a feature-limited Free Edition included, that is activated automatically after the evaluation period ends.
Erich Styger at Freescale has been beta testing the new FreeRTOS+Trace v2.8 with continuous streaming trace capabiilties. He is very positive about it, see his blog
http://mcuoneclipse.com/2015/07/10/freertos-continuous-trace-streaming/
The 20+ views include:
|
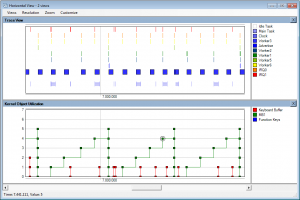
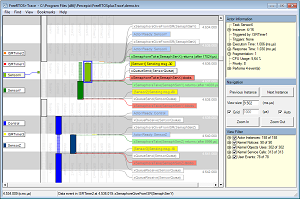
Tasks, System Calls and User Events
|
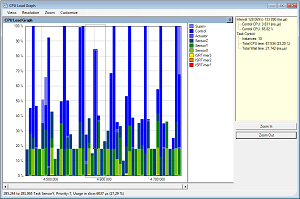 |
CPU Load
|
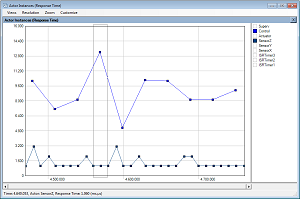 |
Timing Variations
|
 |
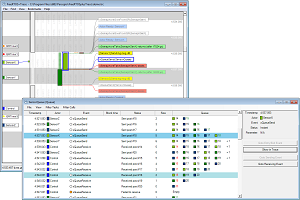
Show Multiple Views Synchronized
|
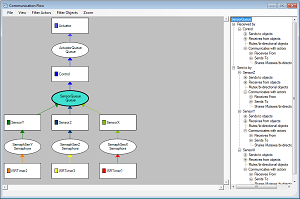 |
Communication Flow
|
 |
Kernel Object History
|
 |
User Events and Signal Plots
|
FreeRTOS+Trace relies on a trace recorder library for FreeRTOS developed by Percepio, in partnership with the FreeRTOS team at Real Time Engineers ltd. The recorder library is delivered in C source code and included in the FreeRTOS+Trace application directory. A link to the recorder folder is available in the Help menu. It is easy to integrate using the guide in the user manual.