Tracealyzer for On Time RTOS-32

Tracealyzer gives an unprecedented insight into run-time embedded software – now also for On Time RTOS-32. Solve complex problems in a fraction of the time otherwise needed, develop more robust designs to prevent future problems and find new ways to improve your software’s performance. The improved understanding allows you to increase the overall software quality and reduce the troubleshooting time.
When working with an RTOS, you have probably noticed that a traditional debugger often is insufficient for many types of problems. Your debugger shows the current system state, e.g., when stopping on a break-point, but how did the system reach this state? How does the task timing look like, how much of the CPU time is used, and by what tasks? And what is actually going on in the run-time system?
Tracealyzer visualize recordings of the RTOS and selected events from your application. This is explained through more than 20 graphical views, that are interconnected and intuitive to use. This can be used as a lab tool during debug sessions, or deployed as a crash recorder in field testing or post-release, assuming storage on the device.
Tracealyzer shows you the “big picture”, high-level views that complement the detailed debugger view. You may have used a trace tool before, but this is something extra. We are unique in focusing on trace visualization and have put years of dedication and passion for the subject into this tool, featuring 20+ innovative views with different perspectives of the trace. The views are designed to be intuitive to read, and are interconnected – you click in one view to open or focus another view on the clicked location. It is best experienced live, so download and try it now – a demo trace is included.
 |
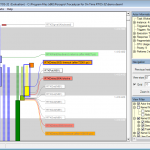
Tasks, System Calls and User Events
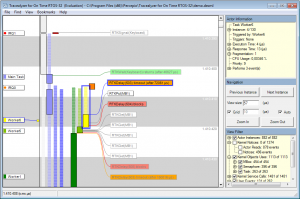
The main trace view shows you all recorded events visualized on a common vertical time-line, including task execution timing, interrupts, system calls and user events. The task and interrupt trace are shown as colored rectangles, and can be presented using three different visualization methods. Events are shown as floating text labels. Zooming is very easy using a click-and-drag selection, which also works as a time measurement tool. Tasks and events can be clicked and highlighted for additional information, including timing and dependencies. The lower right corner contains a powerful filter, and the Finder dialog provides even more powerful filters.The main trace view gives you a detailed understanding when zoomed in on specific intervals, and naturally transforms into an overview when zooming out. You can create multiple trace windows of this type, showing different parts and using different zoom levels and filters. Bookmarks make it easier to find a previous location, and can be saved for future reference.The View Menu provides over 20 other supporting views, where some examples are presented below. Some supporting views can also be accessed by double-clicking on objects in the trace, others using the right-click context menu
|
 |
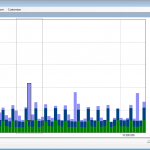
CPU Load
This view presents a horizontal time-line showing the total CPU usage, and also CPU usage per task/interrupt. The CPU Load Graph allows for navigating the main trace view, since a double-click in the CPU Load Graph focuses the main trace view on the clicked interval. Zooming is allowed in this view as well, independently of other views, and filters are available for focusing on individual tasks or interrupts.
|
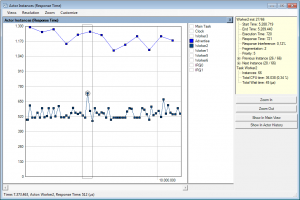 |
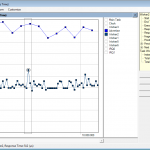
Timing Variations
This is an example of several Actor Instance Graphs, each showing the distributions of a specific timing property for an actor, i.e., a task or interrupt routine. This includes execution time, response time, fragmentation, and several others. Each data point represents one specific execution of a task or interrupt. This graph, Response Time, shows the variation in response times for two selected tasks. Tasks instances with high response times may reveal resource conflicts, e.g., where several tasks or interrupts compete for CPU time in a busy interval. This view makes it easier to spot such locations that may indicate problems or possibilities for optimization.
|
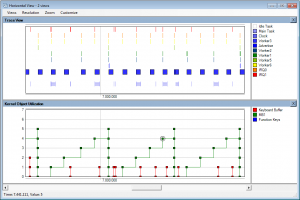 |
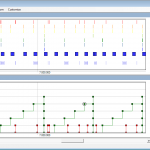
Show Multiple Views Synchronized
All views with horizontal orientation can be combined in a single parent window, with synchronized scrolling. This includes most views except the main trace view, but the task and interrupt trace is available as a horizontal view as well. In this example, a horizontal execution trace is shown together with an execution time plot and the CPU Load Graph. Combining views like this allows for spotting patterns that otherwise would be hard to see using individual views, e.g., how the response time depends on other events, and this also allows for greater customization of the user interface.
|
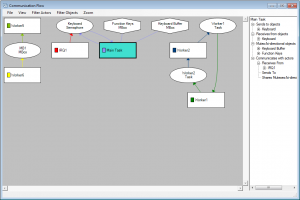 |
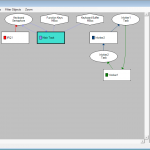
Communication Flow
Many system calls allow for communication or synchronization between tasks. Tracealyzer understands these dependencies and the Communication Flow graph is a summary of all such dependencies found in the trace, in the form of a directed graph. This is a high-level view of the communication dependencies between tasks and interrupts, including the kernel objects used, such as semaphores, data queues and mutexes.Like in all views, double-clicking on a node opens a related view focused on the particular object. Double-clicking on a kernel object (e.g., a semaphore) opens the Object History view (shown below), a list of all events on the specific kernel object. If double-clicking on a task or interrupt, the Actor History view is opened showing all executions of the actor.
|
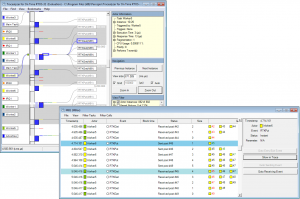 |
Kernel Object History
This view shows all events on a particular kernel object, such as a message queue, semaphore or mutex. The events are presented as a list, and double-clicking on a list item shows the corresponding system call in the main trace view. For message queues and similar objects with send/receive operations, it is possible to follow a specific message from send to receive, or vice versa, and also to inspect the messages (by sequence number) in the queue at any given time.
|
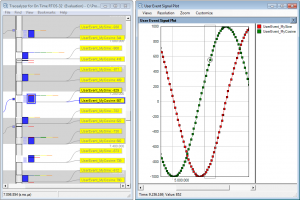 |
User Events and Signal Plots
User-defined events, or User Events, allows you to log any event or data in your embedded application. This gives the flexibility of classic debug “printf” calls, but are much faster as all string formatting is done offline, in the viewer. Since you get the events on the same time-line as the kernel trace, it is easy to correlate the application event with the other views. Moreover, the plotting features allows you to visualize the data. This is highly useful for analysis of control algorithms, and allows you to correlate the plotted data with the scheduling to find the cause of any unexpected disturbances in timing.
|
Tracealyzer for On Time RTOS-32 uses the already available kernel trace feature in On Time RTOS-32, which normally generates text files. Percepio provides a utility for exporting the internal trace data to a new XML format instead, that is then opened in Tracealyzer for On Time RTOS-32.
Trace Exporter for On Time RTOS-32
The purpose of the Trace Exporter tool is to export the trace data from the On Time RTOS-32 Kernel Tracer to the Tracealyzer application. The Trace Exporter creates an XML file which can be opened in Tracealyzer for On Time RTOS-32. The Trace Exporter is delivered in C source code and needs to be included in your embedded application.
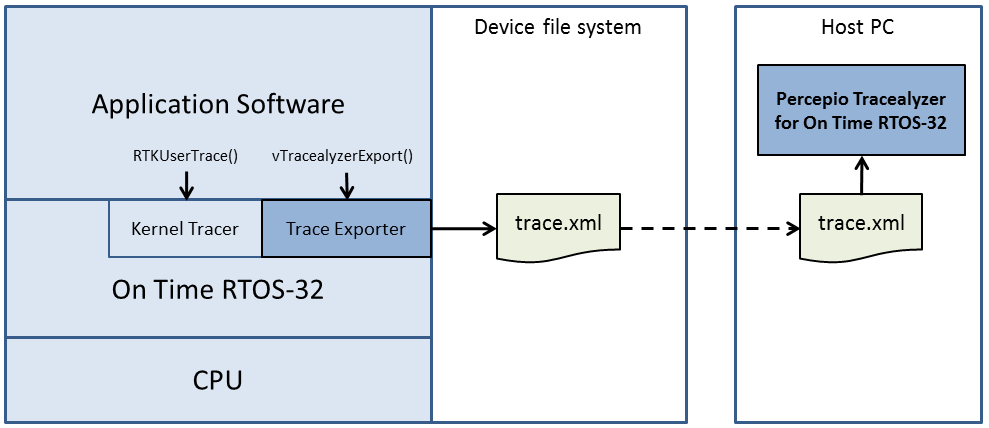
Note that Percepio’s Trace Exporter is only a data converter, not a monitoring solution/recorder. It only runs momentarily, when the export function is explicitly called. The actual monitoring is done by the standard Kernel Tracer of On Time RTOS-32, provided by On Time Systems. The resulting XML file must be manually transferred from the target system to the host PC
Requirements:
- The required On Time RTOS-32 components are RTTarget-32 and RTKernel-32.
- The Debug-version kernel of RTOS-32, where the Kernel Tracer is active.
- Make sure that RF_TRACE_TIME_NS or RF_TRACE_TIME_US is set in RTKConfig.Flags.
Usage:
1) Add “trcExport.c” in your build project.
2) Include the header file “trcExport.h” in your source code.
3) When you like to generate the trace file:
3 a) Stop the Kernel Tracer by calling RTKStopTracing, an API function of the On Time RTOS-32 Kernel Tracer.
3 b) Call vTracealyzerExport(“filename.xml”), which is found in trcExport.c.
Tracealyzer for On Time RTOS-32 can be downloaded here. The application can be evaluated for 30 days, and a demo trace is included for a quick start.